Electric power is supposed to be predictable. Your utility delivers alternating current as a smooth sine wave, and the electrical equipment in your facility uses that power to keep servers, cooling systems, telecommunications equipment, lighting, and other critical loads running reliably.
In practice, the wave is not always perfect.
Modern facilities rely on an increasing number of electronic devices that change how they draw power. Those changes can introduce harmonic distortion into the electrical system. When distortion becomes excessive, it can contribute to overheating, reduced equipment life, unexpected capacity constraints, and performance issues that are difficult to diagnose without the right monitoring data.
Total harmonic distortion, commonly called THD, helps facilities teams measure how far current and voltage waveforms deviate from their ideal sine-wave shape. It turns an invisible electrical quality issue into data your team can understand, track, and act on.
For critical facilities professionals, measuring THD is not just about meeting a technical standard. It is about gaining confidence in the health of the electrical system, identifying emerging risks early, and reducing the uncertainty that leads to reactive troubleshooting.
What Is Total Harmonic Distortion?
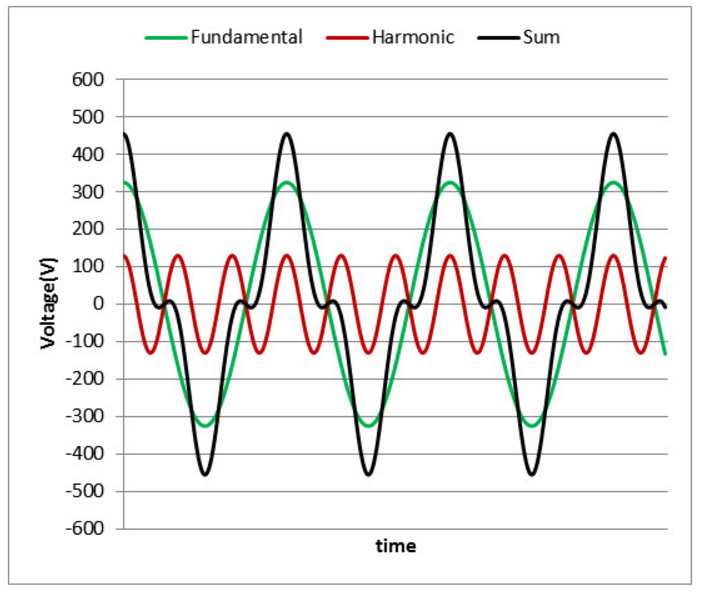
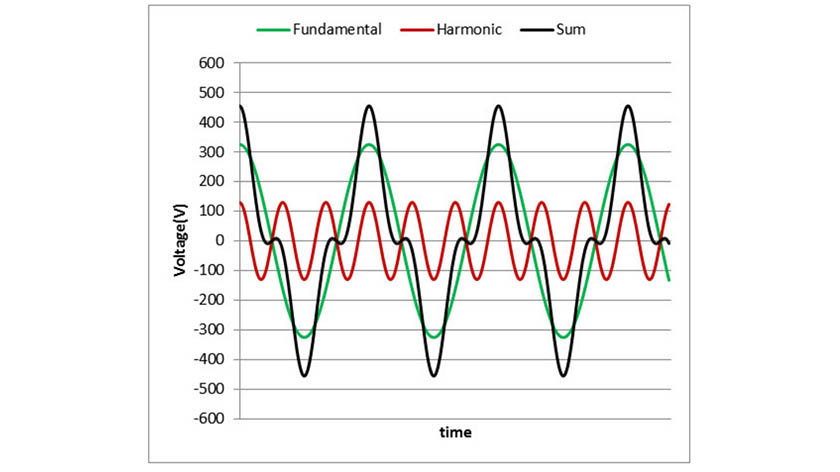
Total harmonic distortion is a measurement of unwanted harmonic frequencies present in an electrical waveform. In an ideal AC electrical system, voltage and current follow a smooth, consistent sine wave at the system’s fundamental frequency.
In North America, that fundamental frequency is typically 60 Hz. If electrical loads draw power in a perfectly linear way, the waveform remains close to that original 60 Hz sine wave.
However, many devices do not draw current evenly throughout the AC cycle. Instead, they pull current in short pulses or irregular patterns. This changes the current waveform and can also affect the voltage waveform throughout the electrical distribution system.
Those added waveform components occur at multiples of the fundamental frequency and are called harmonics.
For example:
-
The fundamental frequency in a typical U.S. electrical system is 60 Hz.
-
The third harmonic is 180 Hz, or 3 × 60.
-
The fifth harmonic is 300 Hz, or 5 × 60.
-
The seventh harmonic is 420 Hz, or 7 × 60.
Total harmonic distortion quantifies the combined effect of these harmonic frequencies as a percentage. A higher THD percentage means the waveform contains more distortion relative to the fundamental frequency.
There are two measurement facilities teams commonly review:
-
Total harmonic distortion of current, or THDi/THDI, measures distortion in the current waveform.
-
Total harmonic distortion of voltage, or THDv/THDV, measures distortion in the voltage waveform.
Current distortion often originates at the load. Voltage distortion can then appear as the electrical system responds to distorted current flowing through its impedance. Reviewing both measurements helps teams determine whether a problem is being created locally, arriving from upstream, or developing through the interaction of loads and the distribution system.
Why THD Matters in Critical Facilities
A modest amount of harmonic distortion is common in modern commercial and industrial electrical systems. The concern is not whether THD exists. It is whether total harmonic distortion has reached a level that creates operational, reliability, capacity, or equipment-life concerns.
Critical facilities teams often have little room for surprises. Data centers, telecommunications environments, healthcare facilities, government buildings, industrial operations, universities, and multi-tenant facilities all depend on stable power distribution. A power quality problem may not announce itself clearly at first. It may appear as excess heat, unexplained alarms, transformer loading concerns, equipment failures, or capacity that disappears faster than expected.
High THD can contribute to several issues.
-
Overheating in transformers and conductors: Harmonic currents can increase electrical losses and generate additional heat in transformers, cables, and switchgear.
-
High neutral current: Triplen harmonics, including the third, ninth, and fifteenth harmonics, can add together in the neutral conductor of a three-phase, four-wire system. This can create an unexpectedly high neutral current.
-
Reduced usable capacity: A transformer, panel, conductor, or UPS may reach thermal limits before its apparent load seems excessive on a basic meter.
-
Electrical equipment stress: Sensitive electronics, microprocessors, motor drives, control systems, and other equipment may be affected by poor power quality conditions.
-
Nuisance tripping and unreliable operation: Harmonics may contribute to false readings, protective-device issues, or operational disturbances in equipment that depends on clean electrical signals.
-
Lower efficiency: Excess heat and losses increase the energy required to support a given load.
-
Harder troubleshooting: Without waveform and harmonic data, teams may spend valuable time chasing symptoms rather than identifying the underlying electrical condition.
The operational value of THD monitoring is simple: it gives your team a clearer view of electrical behavior before a minor power quality concern becomes a costly investigation or an avoidable reliability issue.
Packet Power helps critical facilities teams capture the data they need without adding another burdensome monitoring project. Its wireless monitoring approach is designed to reduce installation complexity while making useful electrical information available to the systems and teams that need it. Learn more about Packet Power’s wireless monitoring solutions and how they help operators lower costs, improve visibility, and avoid outages.
THD Explained With a Simple Example
Think of the voltage supplied by the utility as a clean, smooth wave. A simple resistive load, such as a traditional incandescent lamp or electric heater, generally draws current that closely follows the waveform.
Many modern electronic loads behave differently.
A server power supply, variable frequency drive, battery charger, LED lighting driver, or uninterruptible power supply may convert AC power to DC power internally. During that conversion process, the device may draw current only at certain points in the AC cycle rather than smoothly across the entire waveform.
The facility may still be operating normally, but the current waveform becomes distorted. As more non-linear loads are added to a panel, branch circuit, floor, or facility, the cumulative harmonic effect may increase.
For example, a data center may add new server racks with high-efficiency switched-mode power supplies. Each device may perform well individually, but the combined load profile can alter the electrical characteristics of the upstream system. If the facility lacks circuit-level visibility, the team may not recognize a growing harmonic issue until transformer temperatures rise, neutral current increases, or a capacity-planning model no longer matches what is happening in the field.
That is why electrical monitoring should go beyond total energy consumption. Kilowatt-hours tell you how much energy was used. THD, current, voltage, power factor, frequency, demand, and circuit loading help explain the quality and behavior of that consumption.
Packet Power’s AC power monitoring products are designed to help facilities gather power data at the circuit, panel, equipment, and building levels. This added visibility can make it easier to identify patterns, isolate problem areas, and make decisions with less uncertainty.
What Causes Harmonic Distortion?
Most harmonic distortion in modern facilities is caused by non-linear loads.
A linear load draws current in proportion to the voltage waveform. A non-linear load does not. Instead, it changes the shape of the current waveform, creating harmonic frequencies that can flow through the facility’s electrical system.
Common sources of harmonic distortion include:
-
Servers, storage equipment, and IT power supplies
-
Desktop computers and workstation power supplies
-
Uninterruptible power supplies, or UPS systems
-
Variable frequency drives, or VFDs
-
Adjustable-speed motor drives
-
Battery chargers
-
Rectifiers and inverters
-
Telecom power equipment
-
LED lighting and electronic lighting ballasts
-
Medical imaging and diagnostic equipment
-
Data center power distribution units
-
Copy machines and office equipment
-
Electric vehicle charging equipment
-
Solid-state AC-to-DC power converters
-
Industrial process controls and automation equipment
The amount of distortion created by a load depends on the equipment design, operating state, loading level, electrical configuration, and the strength of the upstream distribution system.
A facility can also experience harmonic issues when equipment is added gradually over time. A building designed around mostly linear loads may later support a much larger percentage of electronic and power-conversion equipment. The original distribution infrastructure may still appear adequate based on nameplate capacity, but the electrical behavior of the loads may have changed substantially.
This is one reason monitoring becomes more valuable as a facility evolves. It gives teams a reliable baseline, helps them spot changes after expansions or equipment upgrades, and provides objective data when evaluating whether mitigation is necessary.
THDI vs. THDV: What Is the Difference?
THDI and THDV both measure harmonic distortion, but they focus on different parts of an electrical system. THDI measures distortion in electrical current, while THDV measures distortion in electrical voltage.
Total Harmonic Distortion in Current (THDI)
THDI measures the harmonic distortion present in electrical current. It is commonly associated with non-linear loads, including variable-frequency drives, UPS systems, LED lighting, computer equipment, switch-mode power supplies, and other electronic devices that draw current in pulses rather than a smooth waveform.
Monitoring THDI can help identify circuits, panels, or equipment loads that contribute harmonic currents to the distribution system. High THDI may indicate that a specific load or combination of loads is placing added stress on transformers, conductors, neutral connections, and other electrical infrastructure.
Total Harmonic Distortion in Voltage (THDV)
THDV measures the harmonic distortion present in electrical voltage. Voltage distortion can occur when harmonic current flows through the electrical system's impedance. It may also result from upstream issues, including utility-side distortion or disturbances elsewhere in the facility.
THDV is important because it reflects the quality of voltage supplied to connected equipment. High voltage distortion can affect sensitive electronics, control systems, motors, communications equipment, and other loads that rely on stable, clean power.
Why the Difference Matters
THDI helps explain what a circuit or equipment load contributes to the electrical system. THDV shows how harmonic currents and the characteristics of the electrical infrastructure affect the power delivered to equipment.
For example, a facility may have high THDI from IT equipment or variable-frequency drives while maintaining relatively low THDV if the electrical system is robust and has low impedance. In a weaker system, the same level of harmonic current can lead to greater voltage distortion and a higher risk of power quality issues.
A high THDI reading does not automatically mean equipment is in immediate danger. Likewise, a low THDI reading does not necessarily mean the system has no power quality concerns. Proper interpretation should account for the facility’s electrical architecture, loading conditions, transformer characteristics, neutral current, voltage distortion levels, equipment sensitivity, and performance trends over time.
Why Continuous Monitoring Helps
A single power quality measurement provides a snapshot of conditions at one point in time. Continuous monitoring gives facilities teams the context needed to identify recurring or load-related harmonic issues.
For example, ongoing data can show whether THD rises during peak IT demand, changes after a UPS upgrade, increases when HVAC equipment cycles on, or appears only at specific panels. This makes it easier to separate isolated events from persistent power quality problems and take corrective action based on actual operating conditions.
How Much THD Is Too Much?
There is no single THD percentage that applies to every electrical system, every load type, or every facility. What is acceptable depends on the point of measurement, the size and stiffness of the power system, the type of equipment served, the ratio of load current to available fault current, and the applicable engineering requirements.
However, IEEE 519 is widely referenced in the United States as a framework for managing harmonic control in electric power systems. It provides recommended limits for harmonic voltage distortion at the point of common coupling, which is generally where the utility and customer systems connect.
A commonly cited guideline for general systems is:
These figures are useful reference points, but they are not a substitute for a qualified electrical engineering evaluation. Current distortion limits are more complex because they depend on the facility’s electrical characteristics, especially the relationship between short-circuit current and maximum demand load current.
Facilities teams should avoid treating a single THD percentage as an isolated pass-or-fail metric. Instead, use the data to answer practical questions:
-
Is THD stable, rising, or appearing only during certain operating conditions
-
Which panels, circuits, or loads have the highest THDI?
-
Is voltage distortion elevated at the service entrance, a distribution panel, or downstream equipment?
-
Are neutral conductors, transformers, or switchgear showing heat-related concerns?
-
Did THD change after a facility expansion, equipment replacement, or shift in operating profile?
-
Are high THD readings associated with lower power factor, abnormal demand, or recurring equipment alarms?
-
Does the facility need a detailed power quality study or harmonic mitigation strategy?
A trusted monitoring system gives you the evidence to ask better questions before an issue becomes urgent.
For a related explanation of how electrical efficiency and apparent power affect facility operations, read Packet Power’s guide to power factor. Power factor and total harmonic distortion are different measurements, but both can help teams understand how effectively electrical power is being used.
The Relationship Between THD and Power Factor
Total harmonic distortion can affect power factor, particularly in facilities with substantial non-linear loads.
Power factor describes how effectively incoming electrical power is converted into useful work. In simple terms, it compares true power, measured in watts, with apparent power, measured in volt-amperes. A power factor closer to 1.0 generally indicates a more efficient relationship between the power delivered and the power used productively.
Traditional discussions of power factor often focus on phase displacement between voltage and current. Harmonics add another factor, as distorted current waveforms can lower the true power factor even when the displacement power factor appears acceptable.
This matters because poor power factor and high harmonic content can both contribute to higher current, increased losses, and greater stress on electrical infrastructure. In a facility with high non-linear loads, reducing harmonic distortion may improve overall power quality and support better electrical efficiency.
Monitoring current, voltage, kW, kVA, power factor, frequency, and THD together provides a more complete view than monitoring any one metric alone. When teams can see how these measurements interact, they can move from assumptions to informed decisions.
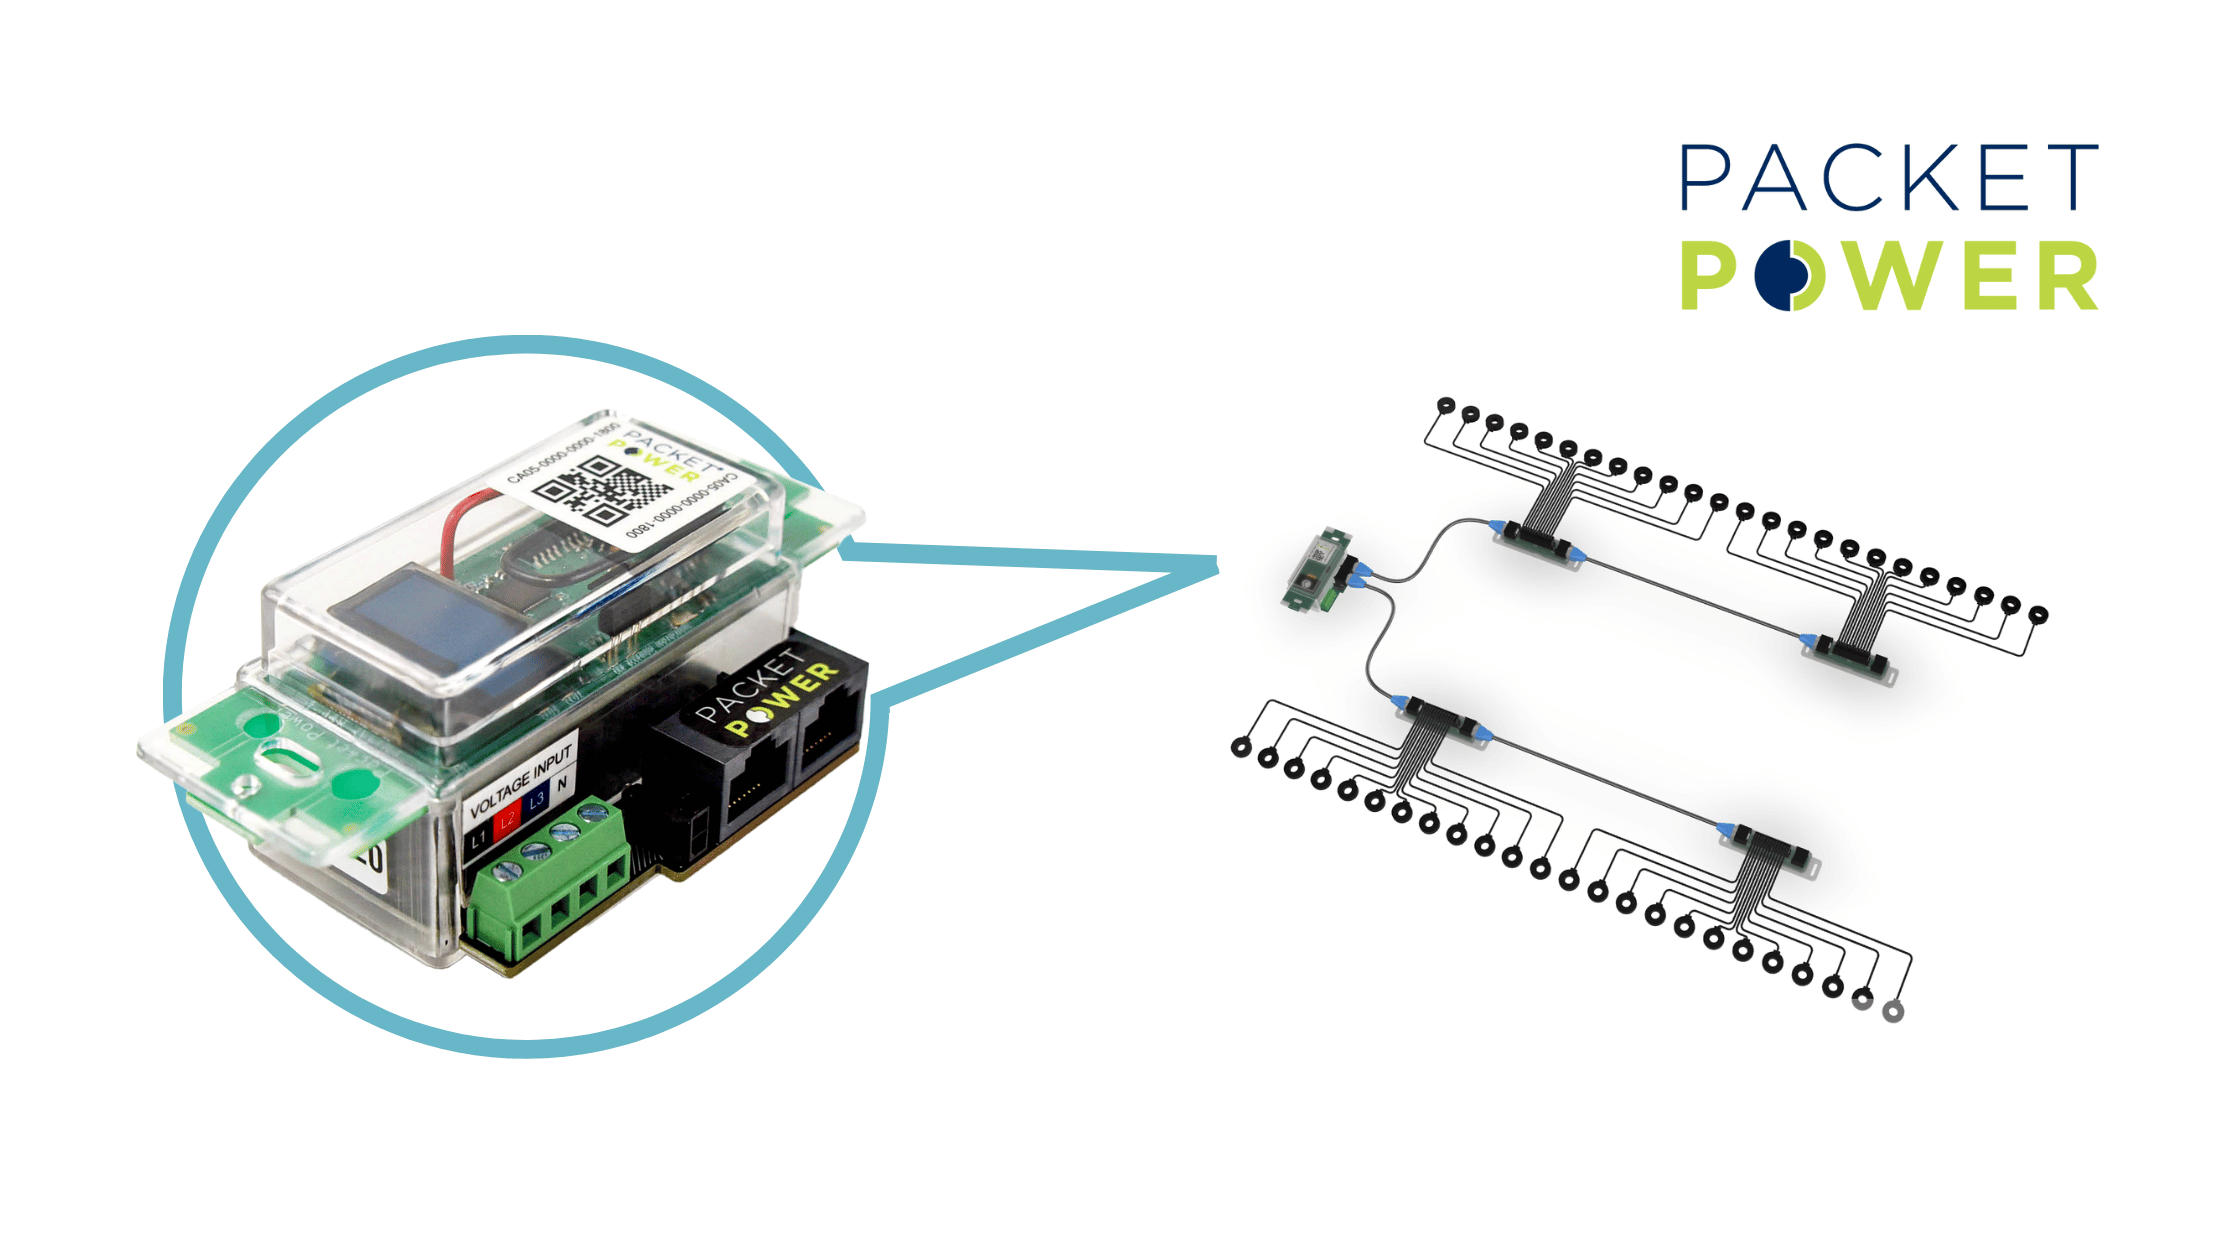
Packet Power’s High-Density Power Monitor supports monitoring up to 120 circuits from a single compact unit and captures electrical measurements, including voltage, current, apparent power, true power, power factor, energy, and frequency. For facilities that need broader visibility without turning monitoring into a major wiring and infrastructure project, this can be a practical path to better electrical awareness.
Common Signs of a Harmonic Problem
Harmonic distortion is not always visible through routine operational checks. In many cases, the warning signs are indirect. Teams may notice an issue in one part of the electrical system without immediately connecting it to power quality.
Potential indicators include:
-
Transformers running hotter than expected
-
Elevated neutral current in three-phase, four-wire systems
-
Circuit breakers or protective devices tripping unexpectedly
-
Repeated failure of capacitors or power factor correction equipment
-
Overheating in cables, busways, panels, or switchgear
-
Equipment alarms that appear intermittent or difficult to reproduce
-
Sensitive electronics behaving unpredictably
-
Discrepancies between expected and measured electrical capacity
-
Unusual vibration or noise from transformers
-
Higher-than-expected energy losses
-
Poor power factor without an obvious load-based explanation
-
Problems that occur after adding more IT, lighting, battery, or motor-drive equipment
These symptoms do not automatically prove that THD is the cause. Electrical systems are complex, and similar symptoms can result from loose connections, overloads, phase imbalance, grounding issues, equipment failures, inadequate sizing, or other power quality concerns.
Still, THD monitoring provides an important diagnostic layer. It helps teams determine whether harmonic distortion should be part of the investigation and whether the issue is isolated or systemic.
How to Monitor Total Harmonic Distortion
The most effective THD monitoring strategy depends on the facility, its electrical architecture, and the operational question you are trying to answer.
A critical facility may need monitoring at several levels:
-
Service entrance or utility connection
-
Main switchgear
-
Transformers
-
UPS input and output
-
Generator and transfer-switch systems
-
Distribution panels
-
Branch circuits
-
High-value equipment
-
Data center rows, racks, or power distribution units
-
HVAC and mechanical loads
-
Tenant or departmental submeters
A single meter at the service entrance may identify a facility-wide power quality issue, but it may not tell you which load or area is contributing to the problem. Circuit-level and panel-level monitoring can help isolate the origin of distortion and how it changes as loads operate.
For example, a team may see elevated THDI at a distribution panel but normal readings at a neighboring panel. That comparison can direct the investigation toward the equipment served by the affected panel rather than requiring a broad, disruptive review of the entire facility.
Packet Power’s monitoring products are built to make this type of visibility easier to deploy. Its power monitoring portfolio includes branch circuit monitors, multi-circuit monitors, embedded AC monitors, smart power cables, AC current transformers, DC monitoring solutions, and supporting network integration options.
Wireless monitoring can be especially valuable in retrofit projects, active data centers, and facilities where adding communications wiring would incur costs, cause disruption, create coordination challenges, or introduce unnecessary IT dependencies. Packet Power’s wireless network is designed to simplify installation and deliver monitoring data to existing building management systems, data center infrastructure management platforms, or EMX software.
From THD Data to Action
Collecting THD data is the first step. The next step is making the data useful.
A practical workflow for managing total harmonic distortion includes the following:
-
Establish a baseline. Record THDI, THDV, voltage, current, power factor, loading, and temperature under normal operating conditions. A baseline gives your team a reference point for future changes.
-
Compare similar circuits and panels. Look for outliers. If one panel has substantially higher THDI than similar panels, investigate the loads it serves.
-
Review trends, not only snapshots. Determine whether distortion increases during peak demand, workload changes, HVAC operation, UPS transfers, charging cycles, or specific production activities.
-
Evaluate system impacts. Review neutral current, transformer loading, conductor temperatures, breaker behavior, and equipment history alongside THD readings.
-
Identify the source. Use circuit-level monitoring to narrow the issue to a specific piece of equipment, equipment group, panel, or operating condition.
-
Consult qualified electrical professionals when needed. A licensed electrical engineer or power quality specialist can assess IEEE 519 considerations, conduct a detailed study, and recommend mitigation options.
-
Measure results after changes. Whether you add harmonic filters, upgrade transformers, redistribute loads, replace equipment, or modify power factor correction, monitoring verifies whether the action delivered the expected result.
This approach supports a calmer, more controlled operating environment. Instead of reacting to a vague electrical concern, teams can use clear data to prioritize the next step and communicate findings confidently to leadership, contractors, engineers, and customers.
Potential Solutions for High THD
The appropriate solution depends on the source, severity, and location of the harmonic issue. Corrective action should be based on electrical measurements and engineering analysis rather than assumptions.
Potential mitigation approaches may include:
-
Installing passive or active harmonic filters
-
Using line reactors or chokes where appropriate
-
Selecting low-harmonic VFDs or drives with active front ends
-
Specifying K-rated transformers for non-linear load applications
-
Oversizing or redesigning neutral conductors where required
-
Separating sensitive loads from high-harmonic loads
-
Balancing loads across phases
-
Improving power distribution design during expansions
-
Reviewing UPS and power supply specifications
-
Replacing aging or poorly performing electronic equipment
-
Adjusting capacitor bank configurations when harmonics interact with power factor correction equipment
Not every elevated THDI reading requires immediate equipment replacement or a major capital project. In some cases, the facility may simply need better monitoring, a more detailed assessment, or an operational change. In other cases, the data may reveal a legitimate risk that deserves prompt mitigation.
The key is visibility. When teams can see electrical behavior clearly, they can make deliberate decisions instead of guessing under pressure.
Make Power Quality Easier to Manage
Facilities teams already have enough complexity to manage. Electrical monitoring should reduce that burden, not create another project involving extensive wiring, difficult integrations, and long deployment timelines.
Packet Power is designed for teams that need dependable data without unnecessary operational friction. Its monitoring solutions are built for critical facilities that need to understand power use, electrical conditions, and environmental performance across panels, equipment, and distributed sites.
Packet Power’s wireless monitors are fully configured, designed for straightforward installation, and supported by a self-managing wireless network that reduces ongoing demands on IT and facility staff. The company’s monitoring data can be made available through its EMX Energy Portal and compatible BMS and DCIM platforms.
EMX provides real-time and historical power and environmental monitoring data, helping teams move from isolated readings to usable operational insight. It can be deployed as a cloud-based service or as locally managed software, depending on facility requirements.
For facilities that require integration into existing systems, Packet Power also provides network integration solutions that can make monitoring data available to BMS, DCIM, EMX, and other secure networks. Supported options include Ethernet gateways, hubs for third-party monitoring devices, and secure one-way data transfer capabilities for separate networks.
Take Control of THD Monitoring
Total harmonic distortion is an important power quality metric because it indicates how modern electrical loads affect the waveforms traveling through your facility. High THD can contribute to heat capacity concerns, electrical inefficiency, equipment stress, and difficult troubleshooting.
The most effective response is not to wait for a failure or an unexplained alarm. Monitor the electrical system, establish a baseline, identify changes early, and use reliable data to focus your team’s time where it matters most.
Packet Power helps simplify that process. Whether you need visibility into branch circuits, panels, transformers, high-value equipment, generator systems, or an entire facility, its wireless power monitoring solutions can help you gather actionable data with less installation complexity and fewer demands on your team.
Explore Packet Power’s data center monitoring solutions, generator and transfer switch monitoring capabilities, and wireless monitoring technology to see how you can build a clearer, more dependable view of power quality and facility performance.
Contact sales@packetpower.com if you'd like more information on a low-cost solution for getting the data needed to mitigate potential high cost problems.




 Packet Power Team
 Packet Power Team : November 2025

![Installing Packet Power Smart Power Cables [VIDEO]](https://www.packetpower.com/hubfs/Blog/Packet%20Power_Smart%20Power%20Cable%20Install.jpg)