 Packet Power Team
Packet Power Delivers Smarter EMX Alerts
EMX provides the ability to apply the criteria that trigger an alert to multiple monitoring units. Now, the emails that are sent when an alert occurs...

HEAR FROM OUR CUSTOMERS
Check out these real world examples of how Packet Power transformed our customers’ operations.

STAY UP-TO-DATE WITH OUR BLOG
Keep up with the latest innovations and trends in energy and environmental monitoring.

LOOKING FOR HELP?
Our technical support team is happy to assist.

Packet Power has enhanced the dashboard feature of its EMX Energy Portal. EMX is the easiest, fastest path to energy and environmental monitoring insights. The cloud service or locally installed software delivers real-time and historical information with built-in and customizable reports. Dashboard functionality enables the creation of custom, graphical views that can be securely shared.
Here's an overview of the latest dashboard enhancements.
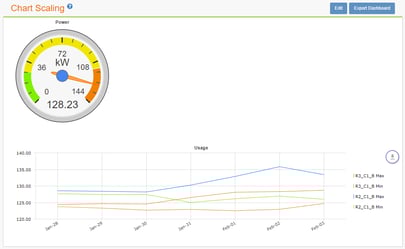
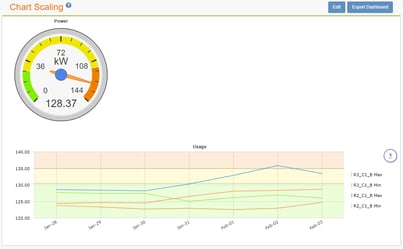
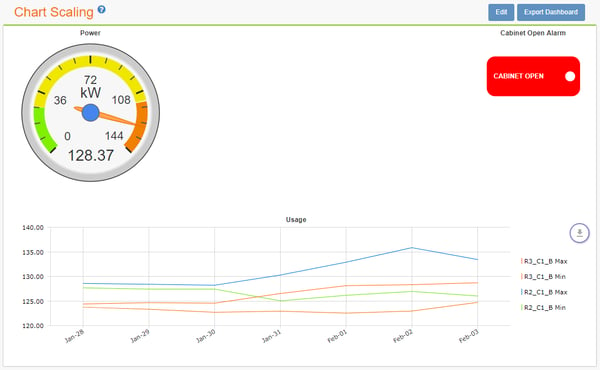
Set color ranges for chart backgrounds
Instead of a white background for line and bar graphs, you can choose to display green, yellow and orange backgrounds by range of readings. This allows a quick view of nodes exceeding their expected range.
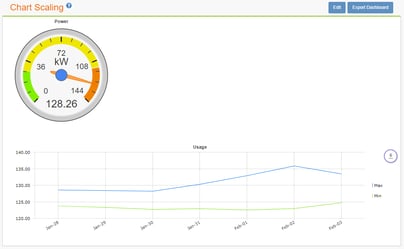
Consolidate nodes within a chart
There may be times you don't need to display individual node data points within a chart. You can now consolidate multiple nodes within a single data point The chart will automatically calculate new min/max/avg values.
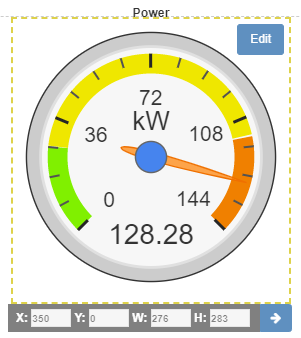
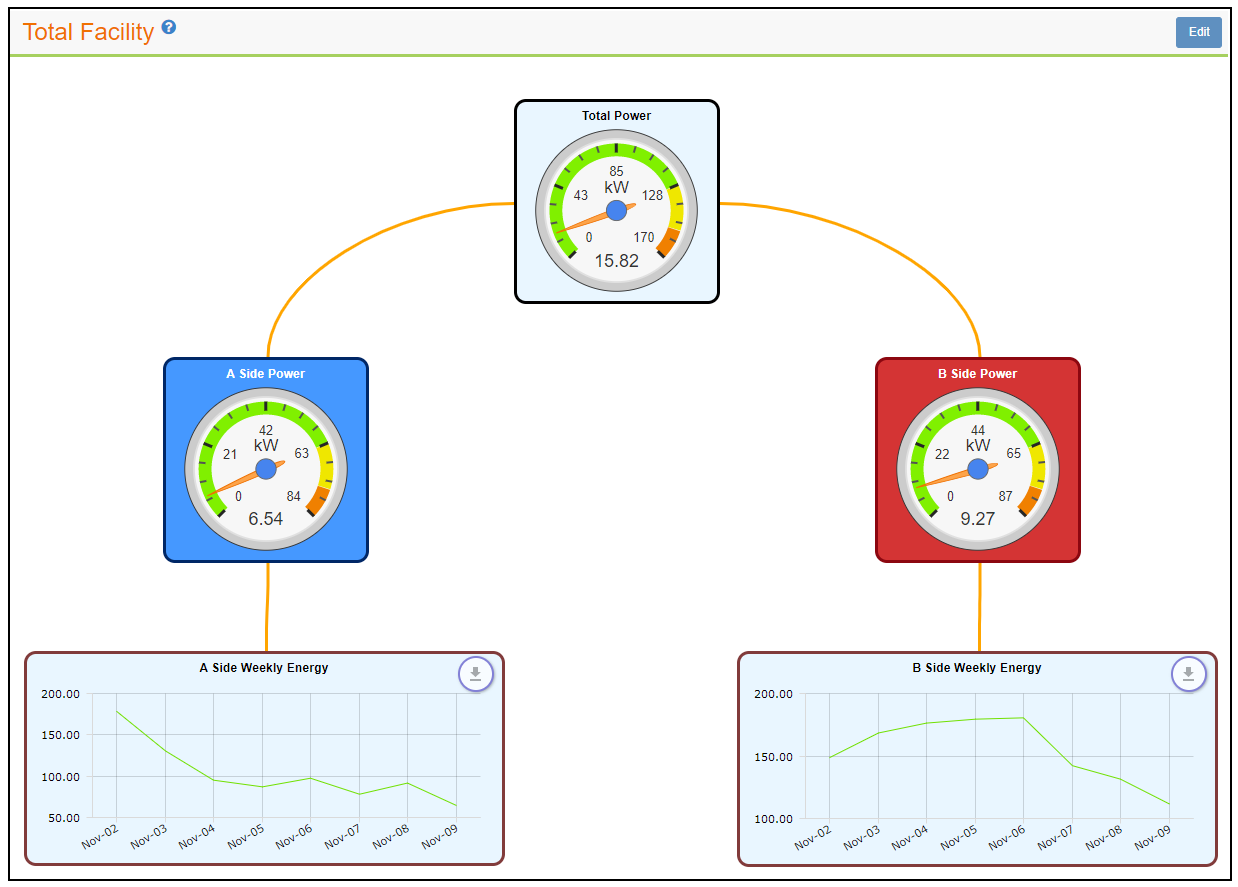
Position objects more precisely within the dashboard
You can position gauges and charts within a dashboard by dragging and dropping. And you can resize an object by dragging its corner in or out. These capabilities may not offer the precision desired so more granular positioning and sizing options have been added. You can specify exact X and Y coordinates and object size in pixels.
Represent alert status as a gauge
Dashboard gauges have been expanded to enable representing node alert statuses as a type of state gauge. This provides a graphical view of critical operating states in addition to EMX's standard email alerts.
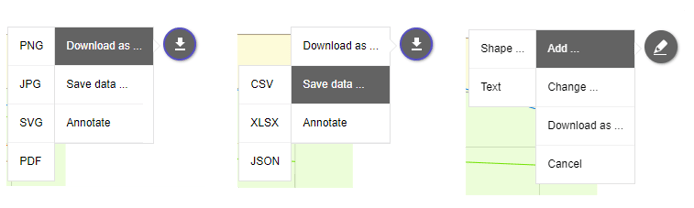
Download and export individual chart data points
In addition to exporting an entire dashboard, you can now:
Complete step-by-step instructions for using these new capabilities are available on Packet Power's EMX Dashboard support.
EMX Energy Portal
Packet Power's EMX Energy Portal delivers the full power and environmental monitoring capabilities at a fraction of the cost and complexity of competing solutions and without the need for external consultants.
Contact your Packet Power Partner or sales@packetpower.com to learn more about EMX, the fastest path to energy and environmental insights.

EMX provides the ability to apply the criteria that trigger an alert to multiple monitoring units. Now, the emails that are sent when an alert occurs...
Packet Power's EMX energy portal makes reviewing and using information even more intuitive with a number of enhancements to how data is viewed,...
Introducing: EMX 4.0 Monitoring just got even easier. Packet Power's EMX software has always given you instant access to customizable real-time and...