 Packet Power Team
1 min read
The Evolution of Data Center Cooling Technologies
Understanding the Basics of Data Center Cooling Technologies Data centers are the backbone of the digital world, housing the critical infrastructure...

HEAR FROM OUR CUSTOMERS
Check out these real world examples of how Packet Power transformed our customers’ operations.

STAY UP-TO-DATE WITH OUR BLOG
Keep up with the latest innovations and trends in energy and environmental monitoring.

LOOKING FOR HELP?
Our technical support team is happy to assist.

Properly cooling a data center is not straightforward. Cold air is one of the most valuable commodities in data center operations. However, optimizing airflow and cooling is challenging without a good map of air movement through your data center. By using differential pressure sensors, it becomes easy to get a clear understanding of the airflow patterns throughout your data center. The cost and ease of implementation can translate to an ROI in as little as one month. Safely raising the ambient temperature by as little as one -degree can reduce energy costs by 4-5%.
Understanding differential pressure zones and airflow allows you to:
Using Packet Power's environmental monitor with a differential pressure sensor, you get comprehensive, real-time data on temperature, humidity and differential pressure. The monitor can be placed in strategic locations. Installation is further simplified with all monitors automatically connecting to the Gateway. No expertise is required as the network is self-configuring and data can be viewed immediately on Packet Power’s EMX Portal or integrated into any BMS or DCIM.

Differential pressure is valuable in monitoring the efficiency of airflow or cooling through a facility. It is important to note that differential pressure is not a measure of airflow, but rather the air pressure that drives the airflow, specifically the difference in air pressure between one area and another.
If the differential pressure between two areas is high, that means that the flow rate of air between the high pressure and low pressure area will be faster. It does not tell us the volume of air flow, only the force.
Differential pressure can be a useful indicator when trying to optimize cooling systems and balancing airflow. Changes in differential pressure validate improvements in airflow such as better sealing of underfloor tiles or racks. It can point out unseen changes in air handling performances that may otherwise go unnoticed (i.e. a decreased differential pressure can be caused from leaks, fan performance, or obstructions).
Being able to observe differential pressure in key parts of the data center, enables airflow to be better understood, contained and directed, creating a more efficient and reliable environment.
You can use machine-learning, AI-powered software systems to crunch the data from your Packet Power environmental monitors and get suggestions for system design changes that can reduce the amount of cooling you need to do. Some of these options will even communicate directly with your hardware to make changes without staff intervention.
If you want to know how to track differential pressure in a data center, the process starts with choosing the right locations to measure and then using sensors that can send reliable data in real time. Differential pressure is simply the difference in air pressure between two points.
By tracking that difference in a consistent way, you can see how air is moving and how stable your cooling strategy really is.
Begin by mapping your airflow path and deciding where pressure differences are most important. Common monitoring points include:
Under floor plenums versus the main room area
Cold aisles versus hot aisles
Inside server racks versus the room around them
Before and after baffles or containment panels
Near critical equipment such as high density racks or network cores
For each location, think in terms of pairs. You are always comparing a higher pressure area to a lower pressure area.
For example, the area under the raised floor is usually higher pressure than the room above the perforated tiles.
To track differential pressure in a data center, you need sensors that use two sensing points, often called the positive and negative ports.
A simple way to deploy them:
Place the positive port tube in the higher pressure zone, such as under the floor near a perforated tile or at the rack air intake.
Place the negative port tube in a lower pressure or ambient zone, such as above the raised floor or on top of the rack away from direct airflow.
Mount the monitor where staff can see the display, and route the tubes so they are protected from damage and kinks.
With Packet Power environmental monitors, differential pressure and temperature can be tracked from the same device. This makes it easy to see not just that pressure changed, but also how that change affects inlet temperatures at the rack.
Once the differential pressure sensors are in place, the next step is to collect and view the data in a central system.
Using Packet Power:
Environmental monitors connect wirelessly to a Packet Power Gateway
The network of devices forms on its own, so there is no special configuration needed
Data flows into the Packet Power EMX Portal, or into any BMS or DCIM that reads Modbus TCP or SNMP
This type of setup lets you track differential pressure, temperature, and humidity from a single interface and correlate them over time.
Tracking differential pressure in a data center is most useful when you know what normal looks like and when you get alerts as soon as conditions change. A good process looks like this:
Establish baselines
Collect data for a period under normal operation.
Note typical differential pressure values in key zones, such as under floor to room, cold aisle to hot aisle, and inside rack to ambient.
Define alert thresholds
Set high and low thresholds so you are notified when pressure drops too low or spikes unexpectedly.
Start with conservative values, then refine as you learn more about your site.
Tie alerts to locations and equipment
Label each sensor clearly with its rack, aisle, or plenum location.
Make sure alerts in EMX or your BMS describe the exact area so staff can respond quickly.
Differential pressure on its own tells you about the force driving airflow. To make good decisions, you need to see how that pressure relates to cooling performance and operational changes.
Use your monitoring system to:
Compare differential pressure trends with inlet and outlet temperatures at the rack
Review pressure graphs after changes such as sealing floor tiles, adding blanking panels, or adjusting fan speeds
Tag events like maintenance work, new equipment installs, or containment changes so you can see their impact on airflow patterns
Over time, this gives you a clear picture of how pressure, airflow, and temperature behave together in your environment.
The real value in tracking differential pressure in a data center is the ability to make targeted improvements, not just react to hot spots.
You can use the data to:
Identify aisles or racks that are starved for cold air due to low differential pressure
Spot leaks or bypass paths where air is escaping instead of flowing through IT equipment
Validate that new containment, baffles, or tile changes are delivering the expected pressure changes
Support decisions to raise set points once you are confident that airflow is strong and stable
When Packet Power environmental monitors feed this data into EMX or your chosen BMS or DCIM, you gain both live visibility and historical trends. That makes it easier to justify cooling changes, confirm their impact, and keep airflow performance steady as the data center evolves.
By following these steps, tracking differential pressure in a data center becomes a clear, repeatable process that supports better cooling efficiency, fewer hot spots, and more reliable operation.
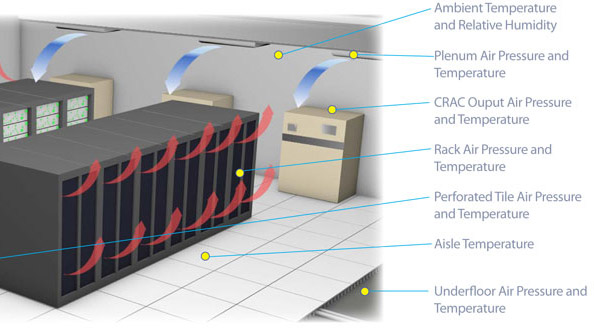
To install a differential pressure sensor, find two areas with different air pressures; an area with higher air flow will always have a different pressure to an area with a lower flow rate (i.e. inside an air plenum versus outside an air plenum). Typical areas for monitoring differential pressure include:
Getting differential pressure data from Packet Power's E306 monitor is simple. Place one of the sensing tubes in a higher pressure zone like the base of a server cabinet by the air intake. Place the other tube in an ambient area with little airflow like the top of exterior of the server cabinet.
Note the area monitoring the higher pressure (or faster airflow) should use the tube marked with the (+) positive symbol. The area with the lower pressure or slower flow should use the tube marked with the (-) negative symbol.
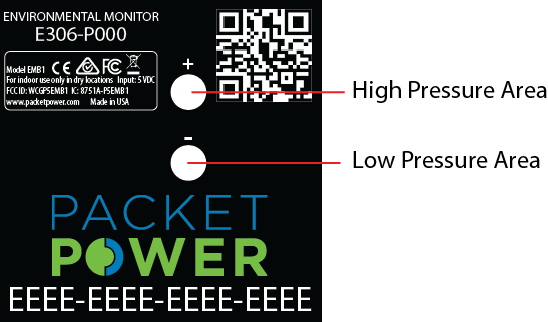
The resulting pressure differential will be indicative of the degree of airflow coming through the cabinet. Differential pressure is expressed in Pascals (±500 Pa in 0.2Pa or ±3% accuracy). Remember that this is not a measurement of airflow but rather a relative indication. A lower differential pressure will indicate a lower airflow rate. A higher differential pressure value indicates a higher flow rate between the high and low pressure areas. Airflow and thermal management goes beyond the scope of this article which is intended as a quick overview.
Packet Power's environmental monitor also allows up to six temperature points to be monitored via remote probes. Adding temperature measurements is an easy way to determine the cooling effectiveness of airflow changes. All measurements can be viewed on the local LCD display of the monitor, or obtained via Modbus TCP/IP or SNMP through the Gateway (integrates with any BMS or DCIM), or via the Packet Power EMX Portal.
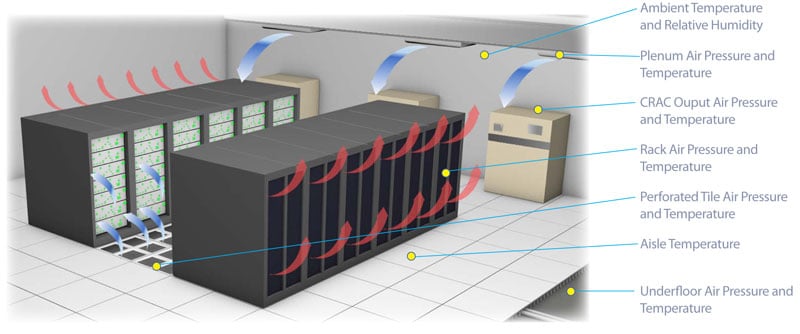
Penum air flow with baffle: The effect of baffle flow control can be monitored using a high pressure tube placed on the source side of the baffle and the low pressure tube on the opposite side of the baffle. A change in differential pressure indicates the effect of the baffle position or changes in the volume of air flow if the baffle position does not change.
Plenum air flow: Plenum air flow can be measured relative to ambient air. The high pressure tube is placed inside the plenum with the low pressure tube in the ambient air. An increase in differential pressure indicates a higher flow rate through any vents (assuming all vent openings remain the same).
Underfloor perforated tile: Placing the high pressure tube underfloor in the proximity of the perforated tile, and low pressure tube above the floor, the differential pressure will indicate the force of air through the floor tiles. Having a higher differential pressure will increase the flow through the perforated tiles. The pressure reading can assist in identifying leaks and confirming the effectiveness of improved underfloor air handling.
Server rack air flow: Measuring the differential pressure between the inside of the server rack and outside the rack (away from direct air flow such as the top exterior of the rack) can indicate changes in the airflow to the rack. A change in differential pressure can indicate a decrease in the pressure of the airflow into the rack assuming the perforations or air flow channels have not changed. Likewise an increase in differential pressure can indicate a higher air flow rate (again assuming no change to the air path). Since the EM3 support up to six remote temperature probes, it is possible to correlate the change in air pressure with changes in cooling performance, monitoring both the hot and cold zones of the rack.


1 min read
Understanding the Basics of Data Center Cooling Technologies Data centers are the backbone of the digital world, housing the critical infrastructure...
1 min read
Our customer Involta has just released a very nice video highlighting one of their data centers in Duluth, Minnesota. Watch it to see an innovative...

1 min read
The latest survey of data center operators shows the biggest challenges the industry is facing. The Uptime Institute aggregated answers from hundreds...