Packet Power EMX Monitoring Software Dashboard Enhancements
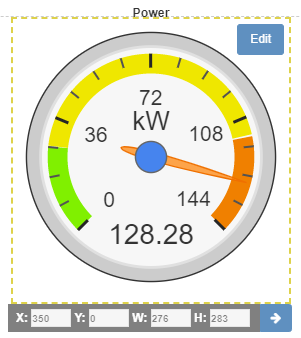
Packet Power has enhanced the dashboard feature of its EMX Energy Portal. EMX is the easiest, fastest path to energy and environmental monitoring...

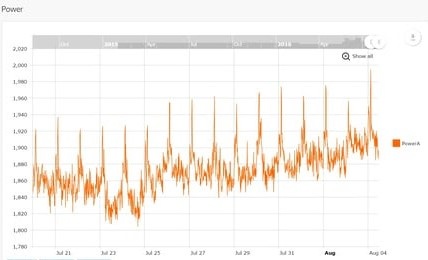
We have added new capabilities to the powerful interactive charting in EMX. This 2-minute video lays out new ways to analyze, annotate and share data on your energy usage trends.
The new capabilities are available now on the cloud EMX service and soon will be added to an update for locally-licensed EMX customers.
The new interactive charting capabilities allow you to indicate trends, add comments and download, print or share pictures and data in a variety of formats.
Contact sales@packetpower.com if you'd like to learn more about Packet Power's EMX Energy Portal delivering power and environmental monitoring insights at a fraction of the cost and without the programming complexity of traditional DCIM software solutions.

Packet Power has enhanced the dashboard feature of its EMX Energy Portal. EMX is the easiest, fastest path to energy and environmental monitoring...

Packet Power recently released several changes to EMX, our power and environmental monitoring software. A notable change is the addition of phasor...

EMX provides the ability to apply the criteria that trigger an alert to multiple monitoring units. Now, the emails that are sent when an alert occurs...